August 17, 2026
16 min read
Conversion Rate Improvement: A Practical CRO Playbook
Drive real conversion rate improvement with this step-by-step CRO playbook. Learn to audit, test, and scale winning variants across every channel.
A site converting at the industry average of 2.35% turns 100,000 monthly visitors into roughly 2,350 conversions. At the top-quarter threshold of 5.31%, that same traffic generates about 5,310 conversions. At the top-decile threshold of 11.45%, it produces approximately 11,450. These figures from conversion rate optimization benchmark data frame conversion rate improvement as a growth system that demands more than visual tweaks.
The strongest gains usually come from connected decisions: attracting a better-matched audience, clarifying the offer, removing friction, adding credible evidence, and running disciplined experiments. A landing-page redesign may lift results, but it cannot repair poor traffic quality or an unmeasured funnel.
The same principle applies after a winning test. Repurposing proven page messages for social distribution through a system such as WaveGen.ai can extend the lift beyond the original landing page, provided each channel preserves the promise and audience fit.
Table of Contents
- Why Conversion Rate Improvement Deserves a Real Framework
- Auditing Your Funnel to Find the Real Leaks
- Designing A/B Tests That Produce Real Winners
- Matching Conversion Benchmarks to the Right Channel
- UX and Copy Changes That Consistently Lift Conversions
- Scaling Winners Through Content Repurposing and Distribution
- Your 30-Day Conversion Rate Improvement Rollout
Why Conversion Rate Improvement Deserves a Real Framework
Conversion rate improvement stalls when teams optimize visible details before identifying the constraint. They adjust spacing, replace a hero image, change a button color, then move on before learning whether the change addressed the actual problem. That approach creates activity, but it does not reliably create progress.
The benchmark gap shows why the work deserves structure. A website converting at 2.35% and one converting at 5.31% or higher are operating at very different levels with the same traffic volume. Reaching 11.45% or above approaches a fivefold increase over the average benchmark, according to the foundational conversion rate benchmark.
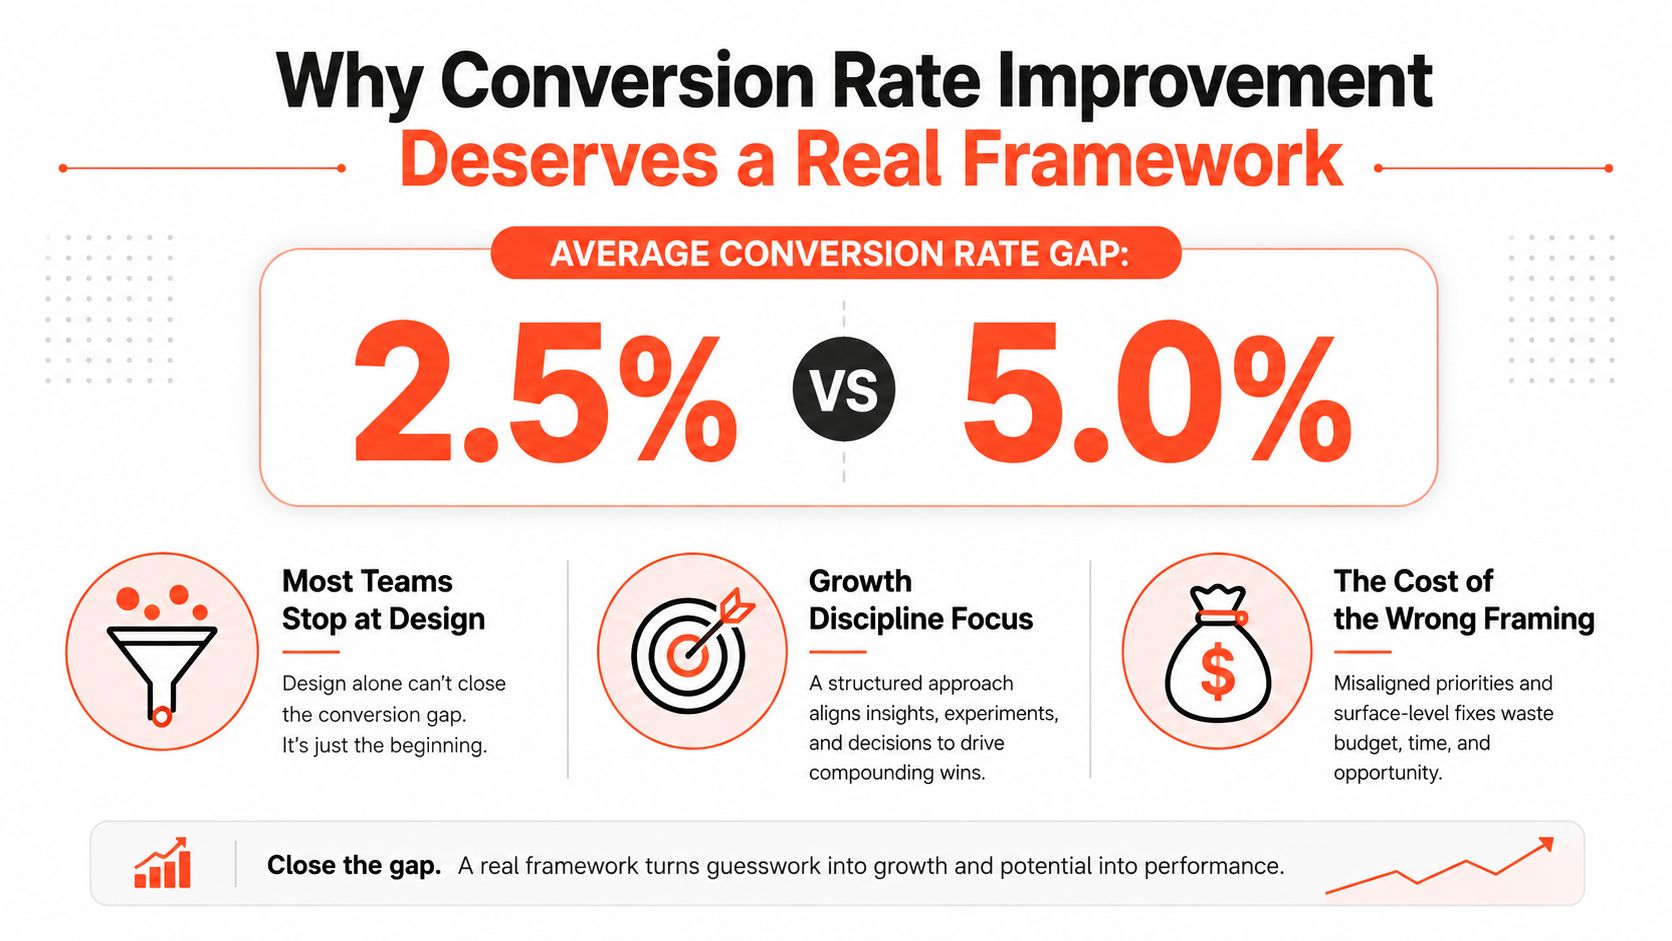
The commercial effect is substantial. If 100,000 monthly visitors generate 2,350 conversions at the average rate, reaching the top-quarter threshold produces roughly 2,960 additional conversions. Reaching the top-decile threshold produces about 9,100 additional conversions over that baseline, without buying another visit. These calculations illustrate the upside of better conversion performance, not a promise that every site can reach those thresholds.
CRO is a system, not a redesign
A dependable program connects four activities:
- Measurement: Define the conversion event, segment traffic, and establish a representative baseline.
- Diagnosis: Find where users hesitate, abandon, misunderstand the offer, or encounter technical friction.
- Experimentation: Test a specific hypothesis under conditions that can produce a trustworthy result.
- Reinforcement: Carry winning messages across the funnel so paid, organic, email, and social visitors arrive with consistent expectations.
Broader customer journey optimization tactics make that system stronger. A landing page is one point in the journey. If an ad promises speed while the page leads with features, or a social post targets a different audience, a successful page test can lose value before the visitor converts.
Winning page messages should also travel beyond the page. Repurposing them for social distribution through a system such as WaveGen.ai can extend the test's impact, provided each channel preserves the original promise and audience fit.
Practical rule: Optimize the expectation created before the click and the confidence built after it, not only the page between them.
A framework also protects against false wins. More submissions may reflect a temporary traffic mix, a campaign spike, or random variation. Without a baseline, a clear hypothesis, and a defined decision rule, the team cannot distinguish durable conversion rate improvement from a persuasive-looking chart.
Auditing Your Funnel to Find the Real Leaks
Before changing copy or layout, map the journey from acquisition to the final action. Start with the conversion event, then work backward through the steps that precede it. For ecommerce, that may include product view, add to cart, checkout start, payment completion, and purchase. For SaaS, it may include landing-page view, signup, activation, and qualified use.
Build the evidence set
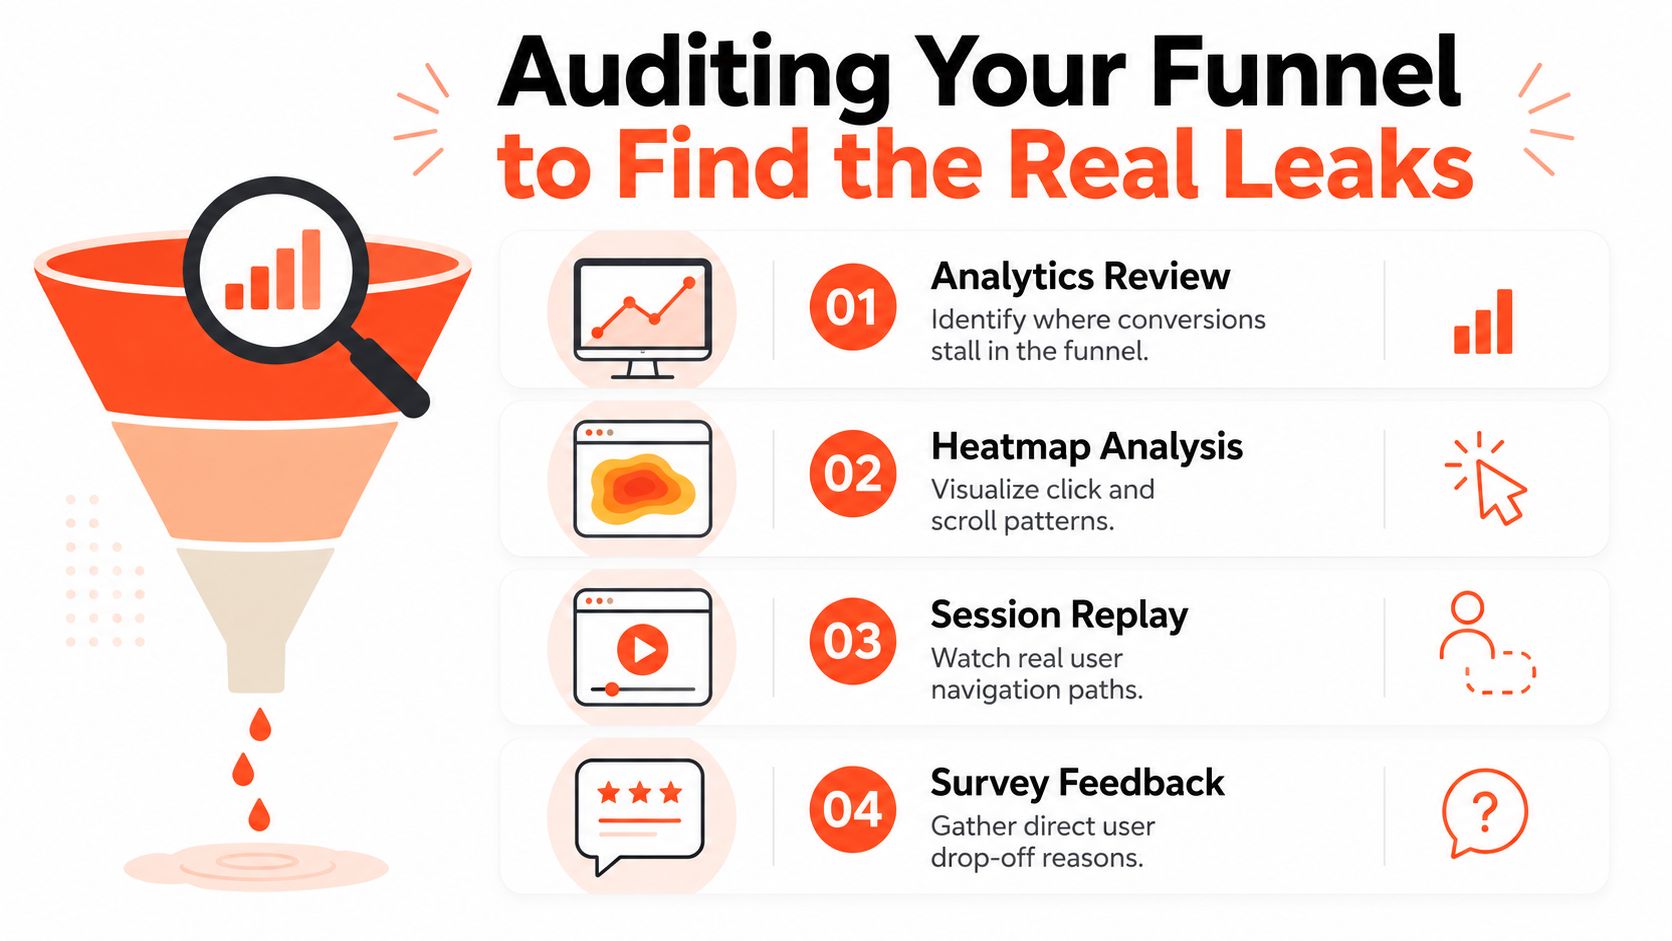
Use four evidence layers. Each answers a different question, and none should stand alone.
Analytics review: Identify the step where the largest share of users stops progressing. Segment by device, channel, campaign, geography, new versus returning visitors, and relevant product or plan. A high-level conversion rate can hide a severe problem for one audience and an excellent experience for another.
Heatmaps: Review clicks, scroll depth, and attention patterns. Look for repeated clicks on noninteractive elements, important information placed below areas few visitors reach, and calls to action competing with secondary links.
Session recordings: Watch a sample of real journeys. You're looking for hesitation, backtracking, form errors, rage clicks, confusing navigation, and moments where users appear to search for information the page should have made obvious.
Qualitative feedback: Ask recent converters what made the decision easy, and ask abandoners what prevented completion. Customer interviews, post-purchase surveys, on-page questions, support tickets, and sales-call notes often reveal objections that analytics can't explain.
The final layer is a heuristic review. Check whether the headline states the offer and outcome clearly, whether the primary CTA matches the visitor's intent, whether trust evidence appears near the decision point, whether the form asks for information the business needs, and whether mobile users can complete the journey without awkward scrolling or tiny tap targets.
Turn observations into a hypothesis backlog
Don't send every observation straight to development. Convert it into a testable statement:
“Because mobile visitors hesitate at the pricing explanation, clarifying the plan differences beside the CTA should increase completed signups without changing the offer.”
Then score each idea with a lightweight ICE model:
- Impact: How much of the funnel does this issue affect, and how close is it to the conversion event?
- Confidence: How many independent signals support the diagnosis?
- Ease: Can the team implement and measure the change without creating technical risk?
Use a simple low, medium, or high rating. The score isn't scientific truth. It forces the team to explain why an idea deserves attention.
A common audit mistake is optimizing a tiny form interaction on a page that receives little qualified traffic while ignoring a major drop-off between product detail and checkout. Capture the baseline, funnel view, segment definitions, key recordings, feedback themes, heuristic findings, and prioritized hypotheses before launching a test.
For ecommerce teams focused on payment and checkout friction, an additional checkout optimization playbook for 2026 can help turn the audit into more specific implementation questions.
Designing A/B Tests That Produce Real Winners
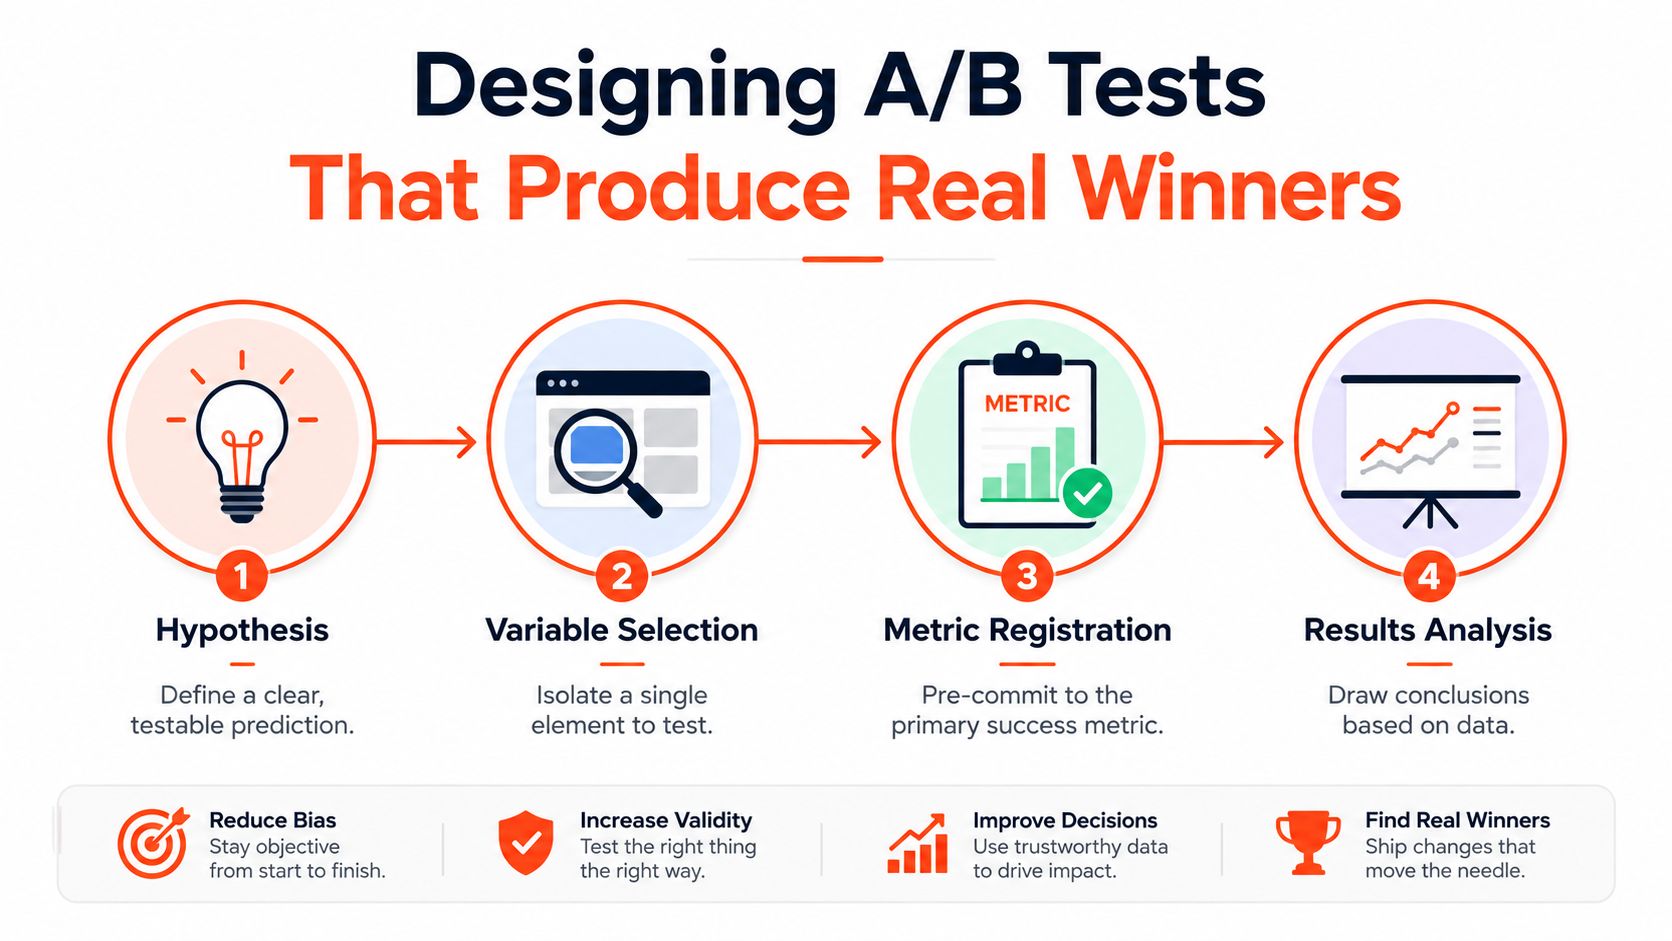
A good A/B test starts with a decision, not a design file. Write down what you believe is wrong, what change addresses it, which audience is affected, and what outcome would justify shipping the variant.
A useful hypothesis has this form: Because [observed problem], changing [specific element] for [audience] should cause [measurable outcome]. If the team can't identify the observed problem, it's probably testing a preference rather than a customer constraint.
Set the test before launch
Choose one primary conversion metric before traffic enters the experiment. Supporting metrics can explain behavior, but they shouldn't replace the registered success measure after results arrive. Also document guardrails such as revenue quality, activation, refund behavior, lead quality, or downstream sales acceptance.
Sample size depends on four inputs: baseline conversion rate, minimum detectable effect, significance level, and statistical power. For a typical ecommerce page with a 5% baseline, a target of a 10% relative lift, significance level α = 0.05, and 80% power, a calculator indicates roughly 31,000 visitors per variant. The underlying A/B test sample-size guidance also notes that many practitioners view fewer than 100 conversions per variant as unreliable.
That requirement is why small teams shouldn't launch a test for a few days and treat an early lead as proof. At low baseline rates, modest improvements need substantial traffic. Broader sample-size planning guidance recommends sizing the experiment first, because underpowered tests create false negatives and very small samples produce noisy results.
Protect the experiment from self-inflicted errors
Allocate traffic consistently between control and variant unless there's a documented reason not to. Estimate the required run time using eligible traffic, not total site traffic, and account for normal business cycles. Avoid changing the audience, offer, tracking, or page during the test unless the change is part of the experiment.
The most common failure is peeking. A team sees significance appear, stops the test, and reports a win. That result may disappear when the experiment collects more observations. The opposite error is equally damaging, teams keep checking until a favorable segment or metric appears.
Read the effect size and confidence interval alongside the significance result. A small apparent lift with a wide interval may not support a rollout, while a clear directional result can still teach you which hypothesis to refine when it doesn't meet the decision threshold.
One benchmark analysis reported a median 37% conversion-rate uplift from winning A/B tests, based on 23 winning variants across 119 experiments run for 34 businesses. The same analysis reported a median winner conversion rate of 8.6% among those winners, as described in the A/B testing uplift analysis. Applied illustratively, a page moving from 5% to about 6.85% represents a 37% relative uplift. That example shows the value of a real win, but it shouldn't become a target you assume every test will achieve.
Matching Conversion Benchmarks to the Right Channel
A single site-wide benchmark hides intent differences. Email visitors may already know the brand or offer, while social visitors may be encountering it for the first time. Comparing final conversion rates without that context can send optimization toward the wrong funnel stage.
Benchmark summaries place global ecommerce conversion rates around 1.64% to 2.76%, B2B website rates commonly around 2% to 5%, and landing-page medians near 6.6%. The channel-focused figures report email traffic around 10.3%, paid search around 2.5%, and social media around 1.8%. Treat these numbers as directional context rather than universal targets, using the channel and industry conversion benchmarks and the Growform guide to conversion benchmarks for comparison points.
| Channel | Typical Conversion Rate | Optimization Priority |
|---|---|---|
| Around 10.3% | Strengthen offer relevance, segmentation, and landing-page continuity | |
| Landing pages | Median near 6.6% | Match page promise to campaign intent and remove competing actions |
| B2B websites | Around 2% to 5% | Improve qualification, proof, pricing clarity, and sales handoff |
| Paid search | Around 2.5% | Align keyword intent, ad copy, and destination-page message |
| Global ecommerce | Around 1.64% to 2.76% | Reduce product, cart, payment, and delivery uncertainty |
| Social media | Around 1.8% | Optimize attention, education, assisted conversions, and retargeting paths |
Channel benchmarks should determine the question you ask, not dictate a target. A social visitor may need several content interactions before a purchase or signup becomes realistic. Judge that channel on qualified profile visits, engaged sessions, email opt-ins, product views, assisted conversions, and return visits instead of last-click sales alone.
Email calls for a different diagnostic. If it converts near the higher end of the channel range, examine segmentation, message-to-page continuity, and offer relevance. Sending more email will not repair a landing page that contradicts the subject line.
Paid search sits between those patterns. The query often signals intent, but the landing page must confirm that the visitor reached the right destination. Teams connecting acquisition behavior with page actions can use this guide to improving click-through rates as a planning resource. The same discipline also helps extend a winning page message into social content, where repeated, consistent exposure can support assisted conversions before the eventual signup or purchase.
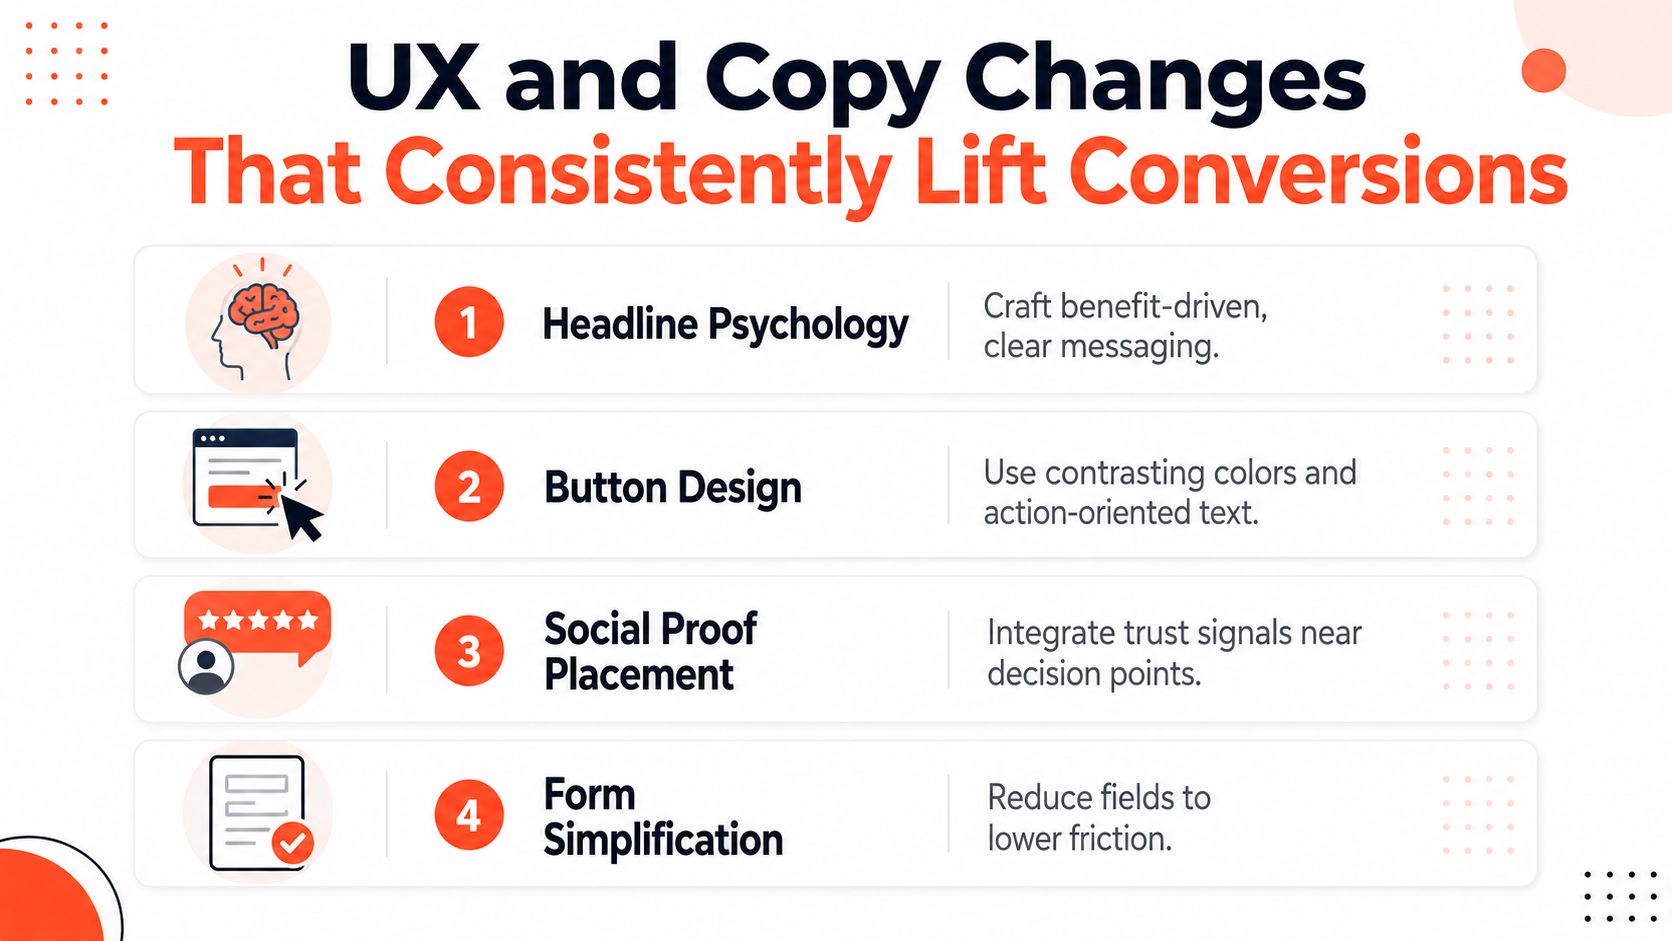
UX and Copy Changes That Consistently Lift Conversions
Strong UX and copy changes reduce uncertainty at the moments that determine whether a visitor continues. The page should make four answers easy to find: what the product does, who it helps, what happens after the click, and why the company deserves trust.
Make the first screen do useful work
Replace vague headlines with a specific outcome and product category. “Simplify team reporting” becomes clearer when paired with the audience and mechanism, such as “Reporting software for finance teams that need one reliable monthly view.” Customer research should determine the wording, but the operating principle is consistent: clarity beats cleverness when visitors arrive with limited context.
Give the page one primary action. “Start a free trial,” “Book a product walkthrough,” and “See available plans” explain the next step. “Submit” only labels a form event. Keep secondary actions for different intents, but give them less visual weight so the page still has a clear path.
A practical message hierarchy looks like this:
- Headline: State the offer and customer outcome.
- Support copy: Explain the mechanism, qualification, or key objection.
- Primary CTA: Name the next action in the visitor's language.
- Proof: Place relevant evidence close to the decision point.
- Risk reduction: Clarify terms, support, cancellation, delivery, or security.
Reduce friction where commitment happens
Ask for the information the next business process needs. If sales does not use a field, remove it or collect it later. Inline validation, clear error messages, autofill support, and sensible grouping usually improve completion more reliably than decorative form treatments.
Pricing pages create friction when visitors must compare plans across scattered sections. Put meaningful differences in one readable comparison, explain who each plan suits, and make the next step obvious. For ecommerce, show product details, delivery expectations, payment options, returns, and relevant reviews before the final decision. These details answer practical objections while purchase intent is still active.
Social proof performs best when it addresses the objection blocking action. A customer quote about setup speed belongs near an implementation concern, while a review about fit belongs near product selection. Logo strips can provide reassurance, but specific evidence does more work.
Use urgency only when it reflects a real constraint. Countdown timers for evergreen offers, fake scarcity, and hidden fees can produce short-term clicks while weakening trust and future conversion quality.
Personalization also needs restraint. A 2026 review reports implementations improving conversion rates by up to 15%, including one cited study of 35 ecommerce deployments with average gains of 15.3% and a top quartile reaching 22.7%, according to the review of personalization evidence. Those figures do not justify complex tooling before a tested baseline exists. Start with meaningful segments and behavior-based relevance. Expand only when the data and governance can support it.
Test the message on the landing page first, then carry the winning promise into distribution. Teams converting tested messaging into social posts can use this social media copywriting guidance to preserve the same promise while adapting the format and opening for each channel. Consistent language helps visitors recognize the offer before they return to the page.
Scaling Winners Through Content Repurposing and Distribution
An A/B winner improves the experience for visitors who reach the tested page. To extend that impact, extract the winning variant's strongest promise and reuse it across channels before the visit occurs. A clearer value proposition, objection answer, proof point, or CTA can shape expectations in social posts and improve the fit of traffic arriving on the landing page.
The goal is a consistent sequence, not a copied page everywhere. Preserve the language that earned a positive response, then adapt its format, opening, and level of detail to each channel. This connects classic landing-page CRO with modern content distribution, so one validated message can inform the acquisition system rather than remain inside the testing platform.
Use a repeatable asset workflow
A practical workflow looks like this:
- Capture the winning message: Save the exact headline, supporting argument, visual angle, and CTA from the experiment record.
- Set the brand system: Define colors, fonts, logo treatment, tone, and approval rules in the chosen content workflow.
- Create channel-native assets: Turn the source into a LinkedIn carousel, short video script, quote card, caption set, and educational post. Each format should stand alone while pointing toward the same next step.
- Review the claims: Remove unsupported promises, check links, and confirm that the social version does not imply a result the landing page cannot substantiate.
- Publish and observe: Track qualified visits, engaged sessions, assisted conversions, and downstream conversion behavior by asset and channel.
A system such as WaveGen.ai can turn an article, newsletter, podcast script, blog post, or YouTube transcript into carousels, short videos, quote cards, captions, hashtags, and platform-specific formatting. Its brand kits store colors, fonts, logos, and voice. The visual editor lets a team revise the output before scheduling or publishing across Instagram, TikTok, LinkedIn, YouTube, and Facebook.
Teams exploring AI for content marketing can apply that workflow to CRO. WaveGen.ai supports consistent distribution of a validated insight, giving a small team a practical way to test whether stronger message-market alignment improves the quality of traffic reaching the original page.
A winning page message is an asset. Treat it as source material for the entire acquisition system, not as a file that stays inside the testing platform.
Measurement still requires discipline. Do not claim that repurposing caused a higher final conversion rate only because social reach increased. Use campaign parameters, landing-page variants where appropriate, channel segmentation, and assisted-conversion reporting to separate correlation from evidence. Compare asset-level traffic quality with the tested page's baseline, then keep the formats that attract visitors who continue through the funnel.
Your 30-Day Conversion Rate Improvement Rollout
A month is enough to establish a working CRO habit, not enough to optimize an entire business. Keep the first cycle narrow, measurable, and documented.
Week one establishes the baseline
Define the primary conversion event and confirm that analytics records it consistently. Pull the available historical data, inspect the funnel by channel and device, review recordings and feedback, and identify the largest meaningful drop-off. Save screenshots, dashboards, segment definitions, and known tracking limitations.
Week two turns evidence into tests
Write the hypothesis backlog and score it using impact, confidence, and ease. Select the first experiment based on the strongest evidence, not the loudest stakeholder opinion. Define the primary metric, guardrails, audience, traffic allocation, sample-size requirement, expected duration, and stop rules before launch.
Week three launches carefully
Start the first experiment and, if traffic and instrumentation allow, a second experiment on a separate page or funnel stage. Don't run overlapping changes that make attribution impossible. Check data quality and exposure, but don't stop a test because the chart briefly favors one version.
Week four produces learning
Analyze the result using effect size, uncertainty, segment behavior, and downstream quality. Ship a winner only when the evidence supports it, record what the losing variant taught you, and turn the strongest validated message into a distribution sprint. Repurpose the insight into social assets, then track whether those assets bring more qualified visitors and assist later conversions.
Watch for three warning signs:
- Too many variables: The team changes the headline, layout, offer, and form together, so nobody knows what caused the result.
- Early stopping: Someone declares victory at the first attractive reading.
- Missing documentation: The business repeats old tests because no one recorded the hypothesis, audience, result, or lesson.
In the first hour after reading this, pull the last 90 days of conversion data, identify the single largest drop-off step, and write the first test hypothesis. Don't start with a redesign. Start with one measurable problem and a decision rule your team can defend.
WaveGen.ai turns your existing articles, newsletters, podcast scripts, and videos into on-brand social assets that reinforce tested messaging across major channels. Visit WaveGen.ai to repurpose your next winning CRO insight into a coordinated distribution sprint and start the free trial.
conversion rate improvement
CRO playbook
A/B testing
landing page optimization
content repurposing
Turn this kind of writing into a week of social content.
Paste a blog post, newsletter, or rough draft — WaveGen turns it into publish-ready carousels, captions, and slideshows for every channel.
No credit card · First posts in 2min